
Elektroclock
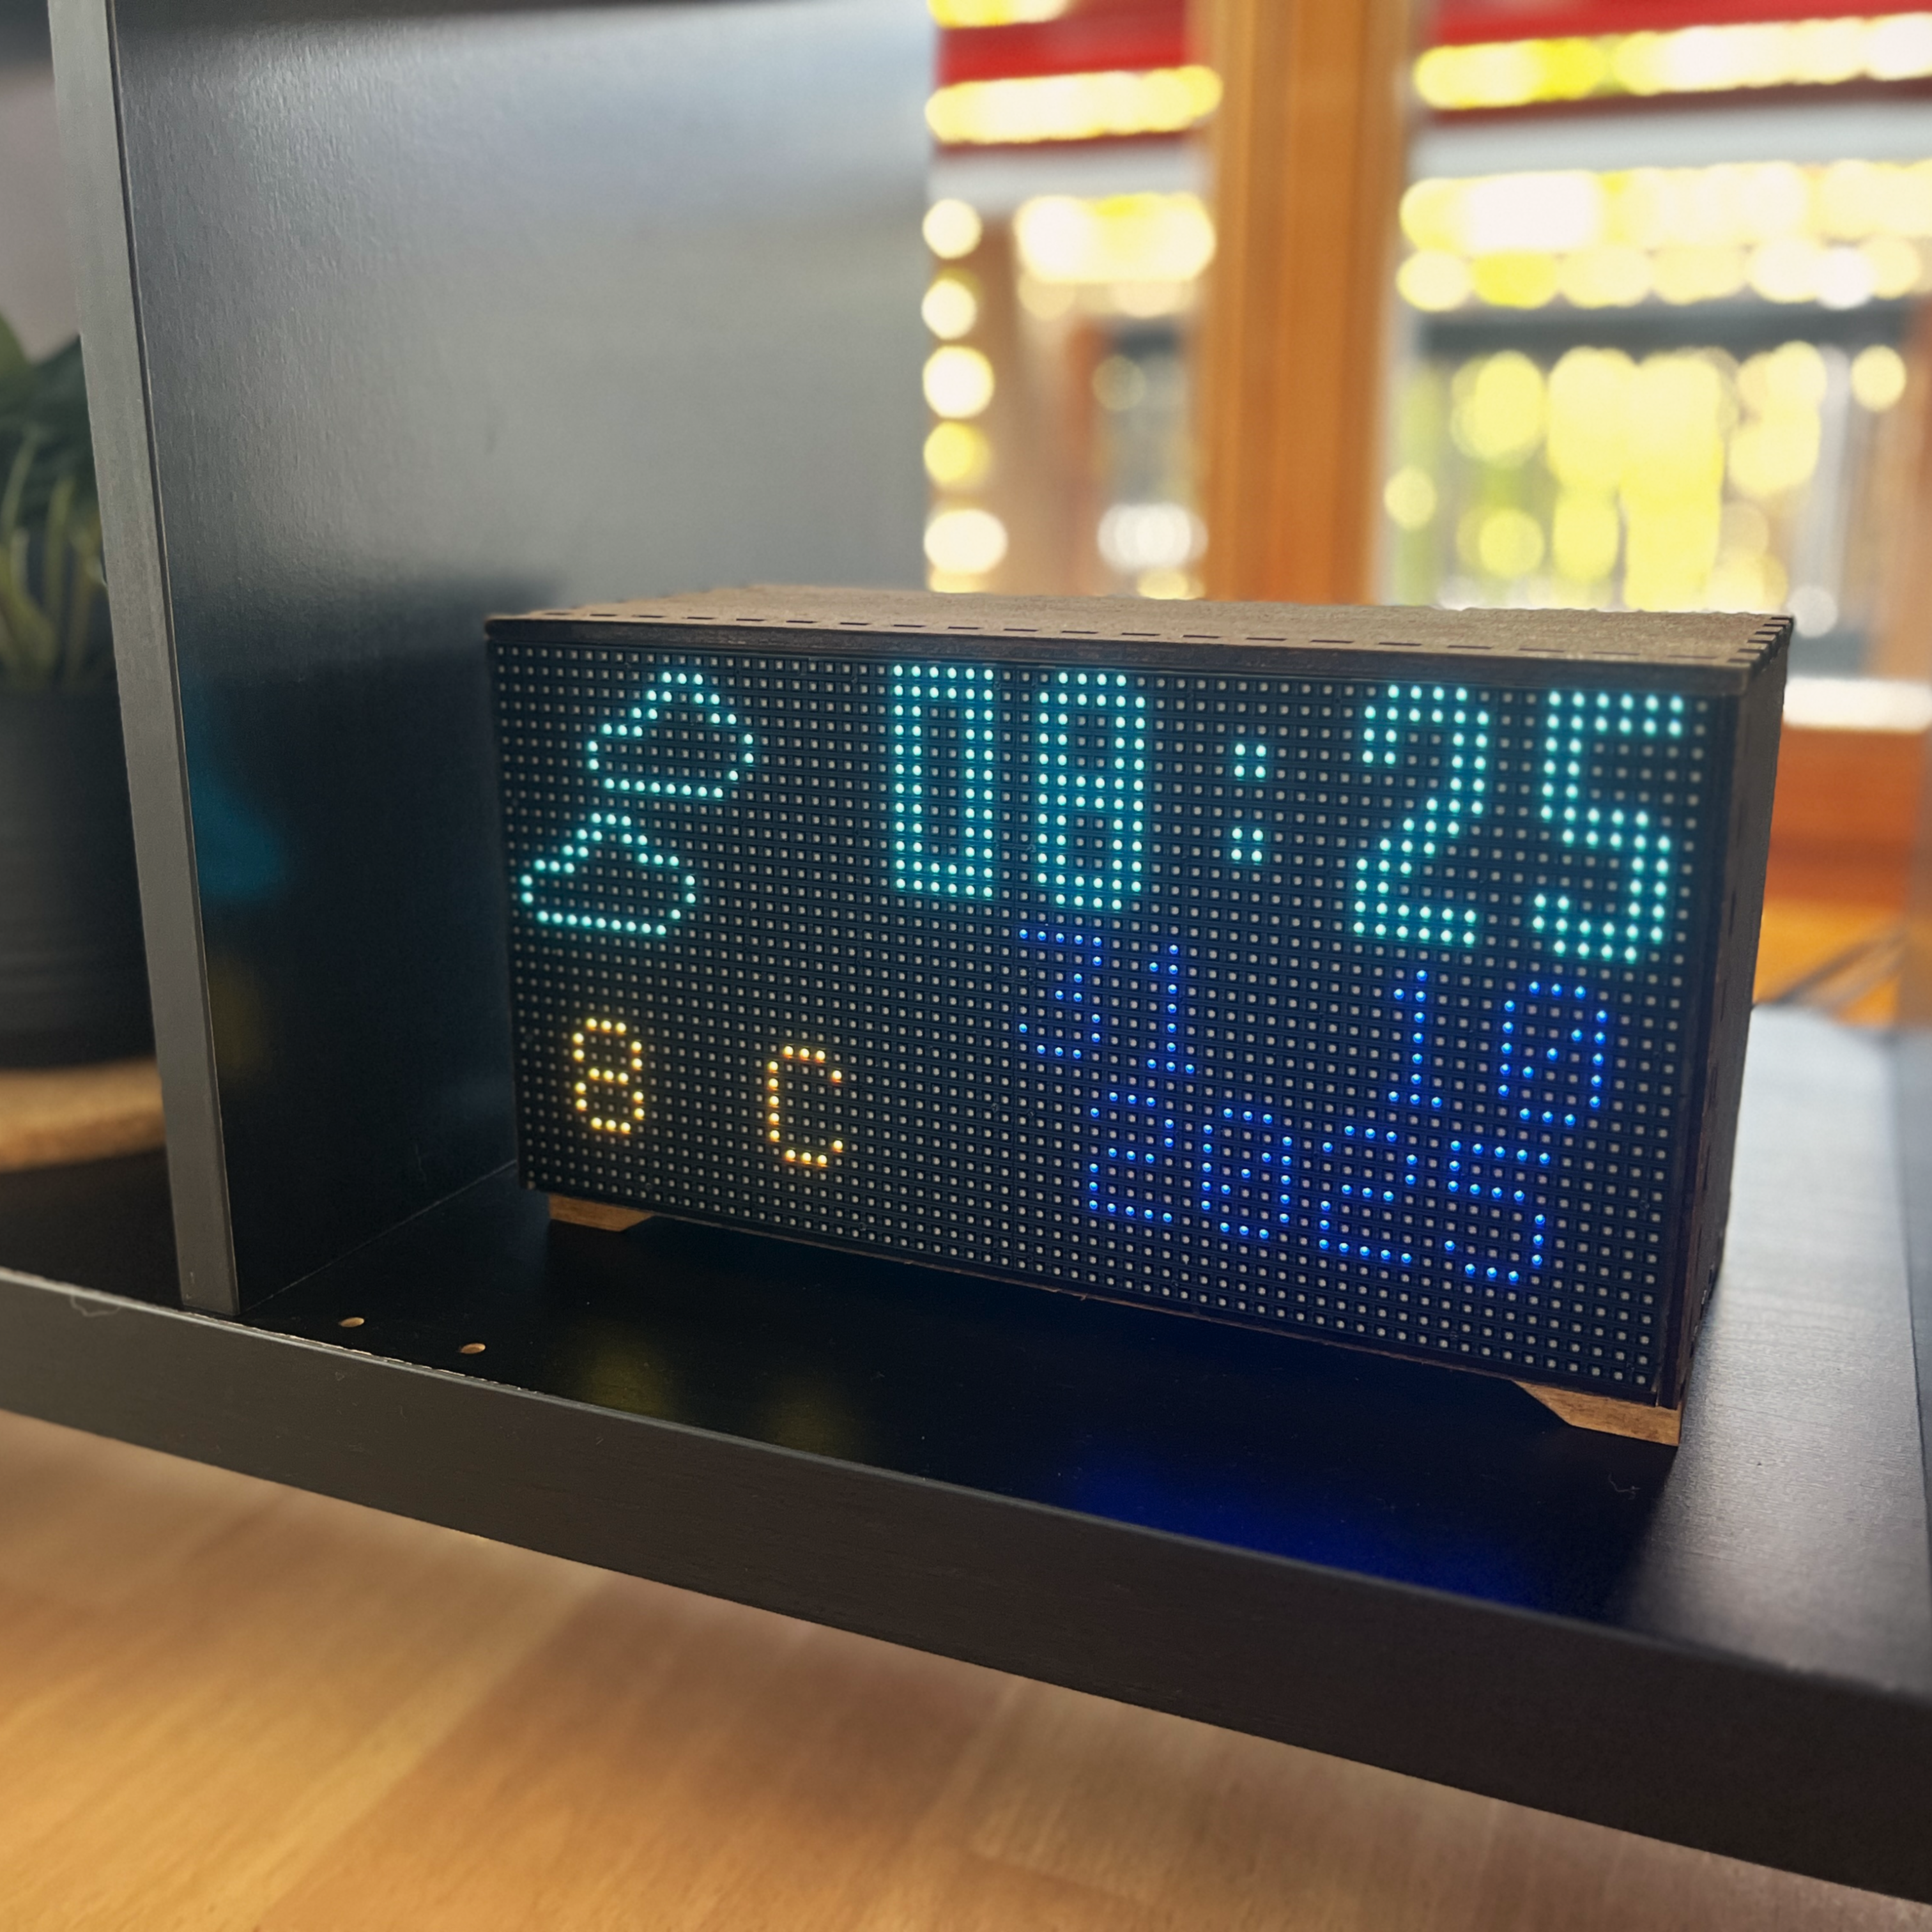
In this project, I build a DIY smart clock using an ESP32, a P4 RGB LED matrix display, Wi-Fi time synchronization, weather data, and a BH1750 light sensor for automatic brightness control.
The clock shows the current time, date, weather icon, and temperature. It refreshes the weather data once per hour, and switches to a dimmer night mode when the room is dark.
1. Required Parts
For this project, I used the following parts:
For the first prototype, the display can be connected with jumper wires. For the final version, I recommend using a PCB and the ribbon cable that comes with the LED matrix display. This makes the wiring much cleaner and more reliable.
2. Connect the LED Matrix Display
Start by flipping the P4 LED matrix display over so the input connector is visible. Connect the display input pins to the ESP32 according to your wiring diagram.
For the prototype, I used jumper wires and a breadboard. I recommend connecting all ground wires to one common ground rail first. This makes the wiring easier to check and ensures that the ESP32, LED matrix, and power supply share the same reference ground.
The display uses a HUB75 interface, so several signal wires are required for the RGB color channels, row selection, latch, output enable, and clock signal.
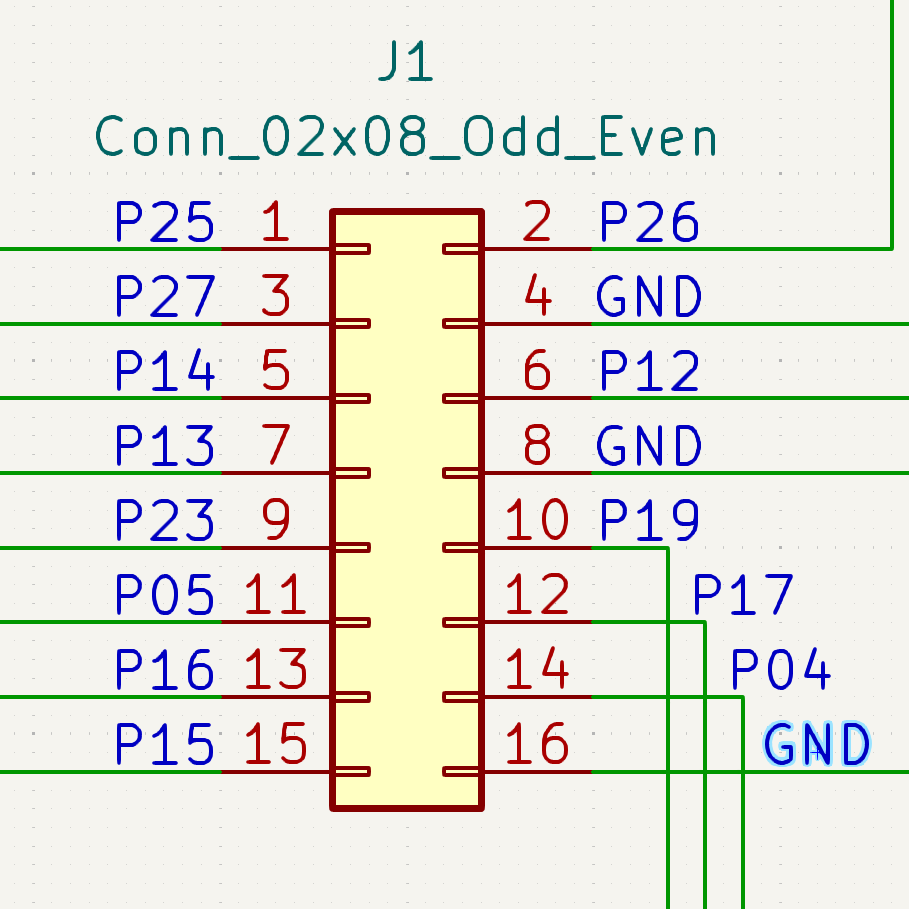
ESP32 to HUB75 LED matrix wiring concept.
3. Power the Display
The LED matrix display requires a stable 5 V supply. For very simple tests at low brightness, the display may work when powered from the ESP32 5 V pin, but this is not recommended for the final version.
4. Test the Display
Before adding Wi-Fi, weather data, or sensors, test the LED matrix display with a simple Arduino sketch. This confirms that the wiring, display library, and ESP32 pin configuration are working correctly.
The test can show a simple text or color pattern on the display. Once this works, the hardware connection is ready for the smart clock software.
RGB Matrix Test Code
This example sketch is used to test an ESP32 with a HUB75 RGB LED matrix panel. The program has two test modes. First, it cycles through 31 solid colors, changing the display color once per second. After that, it switches to a shape animation mode, where different geometric shapes are drawn on the matrix.
The pin numbers and panel resolution can be adjusted in the configuration section of the code to match your own wiring and LED matrix size.
How the code works
The sketch starts by defining the GPIO pins used to connect the ESP32 to the HUB75
RGB matrix panel. These pins must match your own wiring. The panel size is defined
with PANEL_RES_X and PANEL_RES_Y. For a typical 64 × 32 matrix,
the values are set to 64 and 32.
The function build_palette() creates 31 different colors. These colors are
generated using HSV color values and then converted into RGB565 format, which is
the color format used by the matrix display library.
In the main loop, the display changes once per second. In the first mode, the whole matrix is filled with one solid color. After all 31 colors have been shown, the program switches to the second mode, where it draws different shapes such as rectangles, circles, triangles, rounded rectangles, and starburst lines.
The loop is non-blocking because it uses millis() instead of delay().
This makes it easier to add other features later, such as buttons, sensors,
Wi-Fi, or animations.
5. Designing the Clock Layout
After the display was working, I tested different layout ideas for the clock. The goal was to make the most important information easy to read, even from a distance.
The display can show several types of information:
- Current time
- Date
- Temperature
- Weather icon
Because the display resolution is limited, the layout has to be simple and clear. Large digits work best for the time, while smaller text can be used for weather or status information.
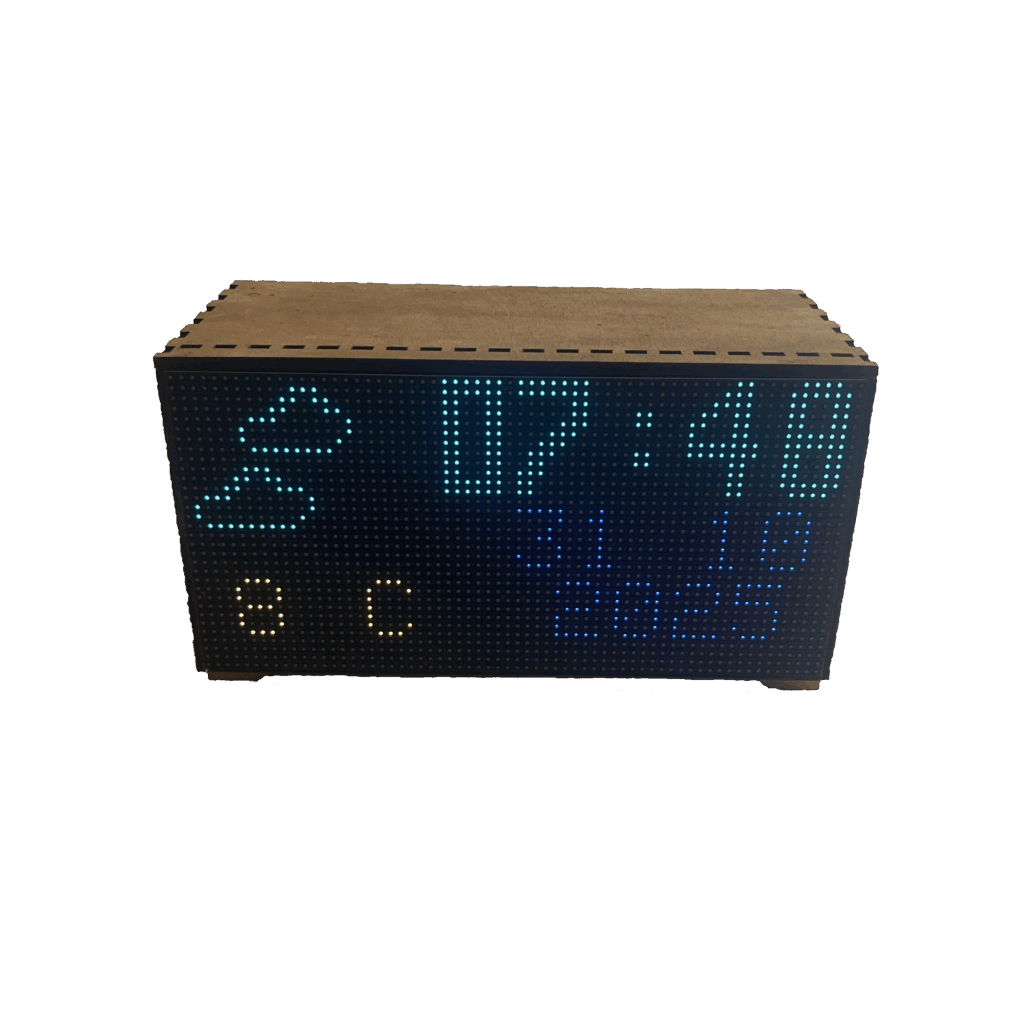
Clock layout with time, date, temperature, and weather icon.
6. Wi-Fi, Time, and Weather Data
The next step was to connect the ESP32 to Wi-Fi. Once connected, the ESP32 can synchronize the time and download weather data.
For the weather information, I used OpenWeatherMap. To use this service, an API key and a location are required. These values are entered in the code as placeholders.
The final Elektroclock code downloads the time and weather data at startup. The weather information is then updated automatically every 60 minutes. This is enough for a clock project because weather data does not need to be refreshed every few seconds.
7. Automatic Brightness Control with BH1750
During testing, I noticed that the LED matrix was too bright in a dark room. To solve this, I added a BH1750 light sensor. This sensor measures the ambient light level and allows the ESP32 to adjust the display brightness automatically.
The BH1750 communicates via I2C, so only a few wires are required:
- VCC
- GND
- SDA
- SCL
The brightness value can then be calculated from the measured light level. In a bright room, the display brightness increases. In a dark room, the brightness is reduced to make the clock more comfortable to look at.
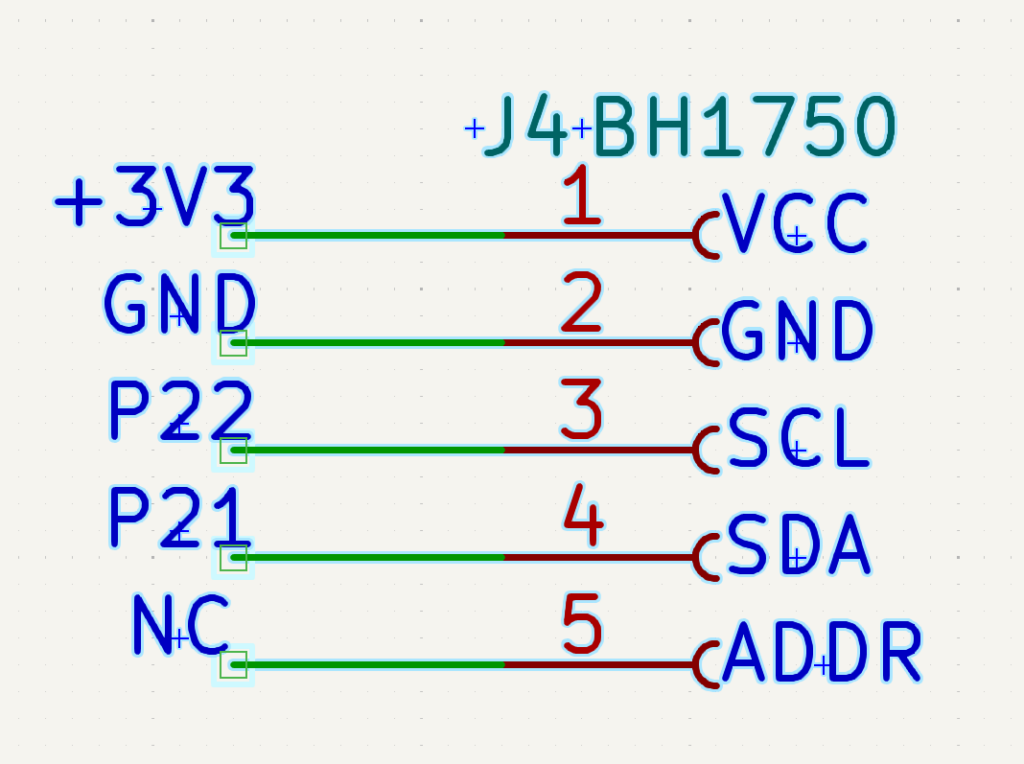
BH1750 wiring for automatic brightness control.
8. Final Software Structure
The final ElektroClock software is split into several logical parts:
You can find the full project code below. Create a new Arduino IDE project and name it ElektroClock. Paste the code from ElektroClock.ino into the main Arduino sketch file. Then create two header files named smart_clock.h and custom_fonts.h. Copy and paste the corresponding code into each header file. After that, you can compile and upload the project using the Arduino IDE.
ElektroClock.ino
smart_clock.h
custom_fonts.h
Full Code Explanation
Basic Configuration
At the beginning of the code, the required libraries are included. The project uses the HUB75 matrix library for the LED display, Wi-Fi and HTTP libraries for online data, ArduinoJson for parsing the weather response, and the BH1750 library for the light sensor.
The display pins are defined according to the wiring between the ESP32 and the P4 LED matrix display. These pin numbers must match your own wiring.
The display size is also defined in the code. In this project, a 64 × 32 pixel LED matrix panel is used.
Wi-Fi, Time, and Weather Settings
The smart clock needs Wi-Fi access to synchronize the time and download weather data. For the website version of the code, the Wi-Fi credentials and API key should always be shown as placeholders.
The timezone string is configured for Switzerland and other Central European regions. It automatically handles the switch between winter time and summertime.
What smart_clock.h Does
The file smart_clock.h stores the small weather icon bitmaps and the matrix color definitions. Keeping these icons in a separate header file makes the main ElektroClock.ino file easier to read. Instead of placing long bitmap arrays directly inside the main program, the main sketch only includes the file with #include <smart_clock.h> and can then use the icon names directly.
In this project, the weather icons are stored as 16 × 16 pixel bitmap arrays. Each icon is saved as hexadecimal values. The code later reads these values bit by bit and draws the active pixels on the LED matrix. Examples are sun_bits, moon_bits, clouds_bits, rain_bits, snow_bits, thunder_bits, and mist_bits.
The same file also stores color constants in RGB565 format. RGB565 is a compact 16-bit color format that is commonly used for small displays and LED matrix projects. The file also contains day and night color variables, for example for the time, date, bitmap icons, and temperature.
What custom_fonts.h Does
The file custom_fonts.h stores the custom number font used for the clock display. Instead of using a standard text font, every digit from 0 to 9 is saved as a small bitmap. This gives full control over the shape, width, and readability of the numbers on the 64 × 32 LED matrix.
Each number is 8 pixels wide and 12 pixels high. The file also contains a custom colon bitmap for the time separator. The main sketch can then draw the time by selecting the correct digit array and passing it to the drawing function.
This approach is useful because normal fonts can look too small, too thin, or badly aligned on low-resolution LED matrix displays. With custom bitmaps, the clock digits can be designed exactly for the available pixel grid.
Drawing Custom Bitmaps
The ElektroClock uses small bitmap arrays for the weather icons and the custom number font. The weather icons are stored in smart_clock.h, while the number digits and colon are stored in custom_fonts.h. The weather icons are 16 × 16 pixel bitmaps, and the custom digits are 8 × 12 pixel bitmaps.
A bitmap is a compact way of saving a small image in code. Each bit represents one pixel. If the bit is 1, the pixel is drawn. If the bit is 0, the pixel stays transparent. This makes it possible to store simple icons such as sun, moon, clouds, rain, snow, thunder, mist, and custom number shapes directly in the program memory.
The function drawXbm565() reads the bitmap data byte by byte. Each byte contains eight pixels. The code checks every bit, calculates the correct display position, and draws a pixel only when the bit is active.
For example, a weather icon can be drawn like this:
This draws the sun icon at position x = 1, y = 1 with a size of 16 × 16 pixels.
Drawing the Time with Custom Digits
Instead of using a standard text font for the time, the clock uses custom digit bitmaps. This gives better control over the look of the time display and makes the digits easier to read on the LED matrix.
The time is first read from the ESP32 local time. Then the hour and minute values are split into individual digits. Each digit is drawn with the draw_digit() function.
The digits are placed on the right side of the display. The weather icon and temperature are shown on the left side.
Weather Data and Icon Selection
The weather data is downloaded from OpenWeatherMap. The code creates a request URL using the selected location and API key. The response is returned as JSON data.
After the HTTP request, the JSON response is parsed. The temperature is converted from Kelvin to Celsius, and the weather ID is saved. This ID is later used to choose the correct weather icon.
The icon is selected based on the OpenWeatherMap weather ID. For example, thunderstorm IDs are in the 200 range, rain IDs are between 300 and 599, and clear sky uses ID 800.
The weather update does not run every second. Instead, the code uses a counter. When the counter reaches 3600, it is reset and new weather data is downloaded.
Automatic Brightness and Night Mode
During testing, I noticed that the LED matrix can be too bright in a dark room. To solve this, I added a BH1750 light sensor. The sensor measures the ambient light level in lux. The code then chooses a suitable brightness level for the display.
The code also changes the display colors depending on the time of day. During the day, the clock uses brighter colors. At night, it switches to a dim blue color so the display is less distracting.
Main Setup Function
The setup() function prepares all hardware and online services. First, the serial monitor is started for debugging. Then the ESP32 connects to Wi-Fi, initializes the BH1750 sensor, starts the display, synchronizes the time over NTP, and performs the first weather request.
Main Loop
The main loop runs continuously. Every second, the ESP32 reads the light level, clears the display, draws the time, updates the brightness and color mode, draws the date and year, and displays the weather information.
This simple loop structure makes the project easy to understand. The display is redrawn once per second, while the weather request is handled separately inside get_weather() so the API is not called too often.
9. From Prototype to PCB
The breadboard prototype worked, but the wiring was messy. A P4 matrix display needs many signal connections, so Dupont wires can quickly become difficult to manage.
To make the project cleaner and more reliable, I designed a custom PCB. The main advantage of the PCB is that the original ribbon cable from the display can be used. This reduces the number of loose wires and makes the assembly much easier.
I also added a pin header to the PCB so that unused ESP32 pins remain accessible. This makes future upgrades possible, for example adding buttons, extra sensors, or a different enclosure design.
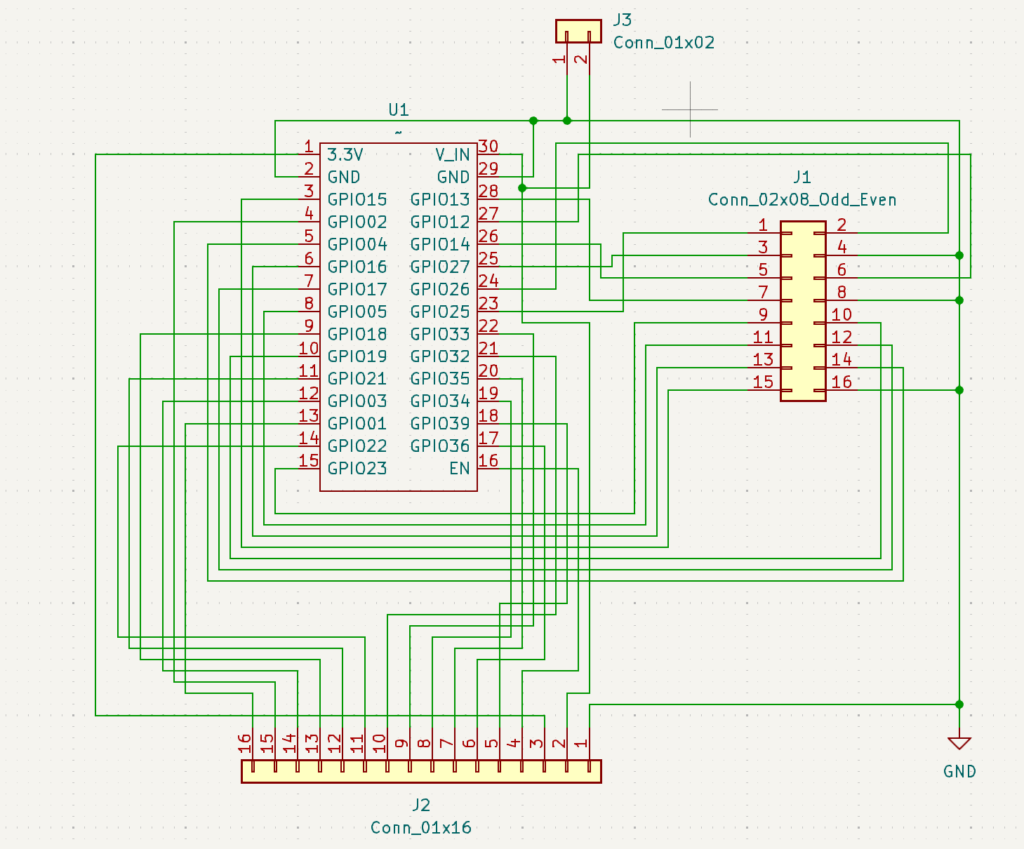
Elektroclock schematic.
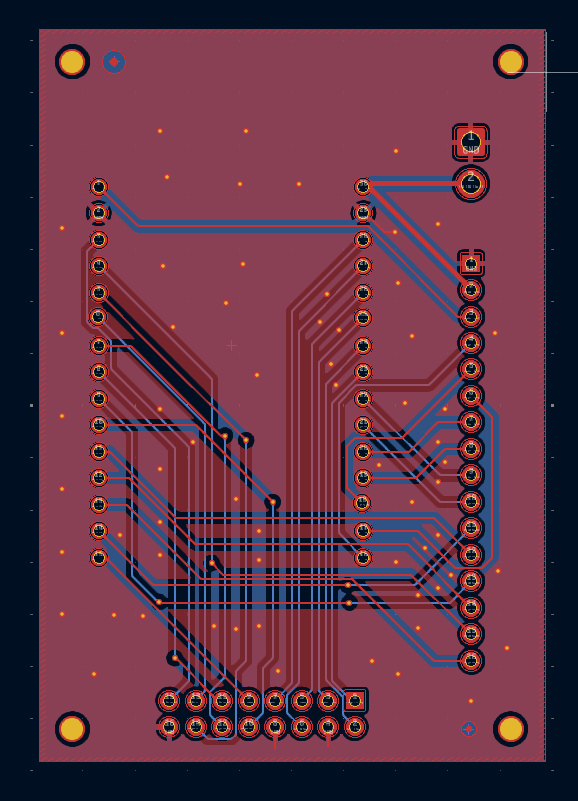
Elektroclock PCB layout.
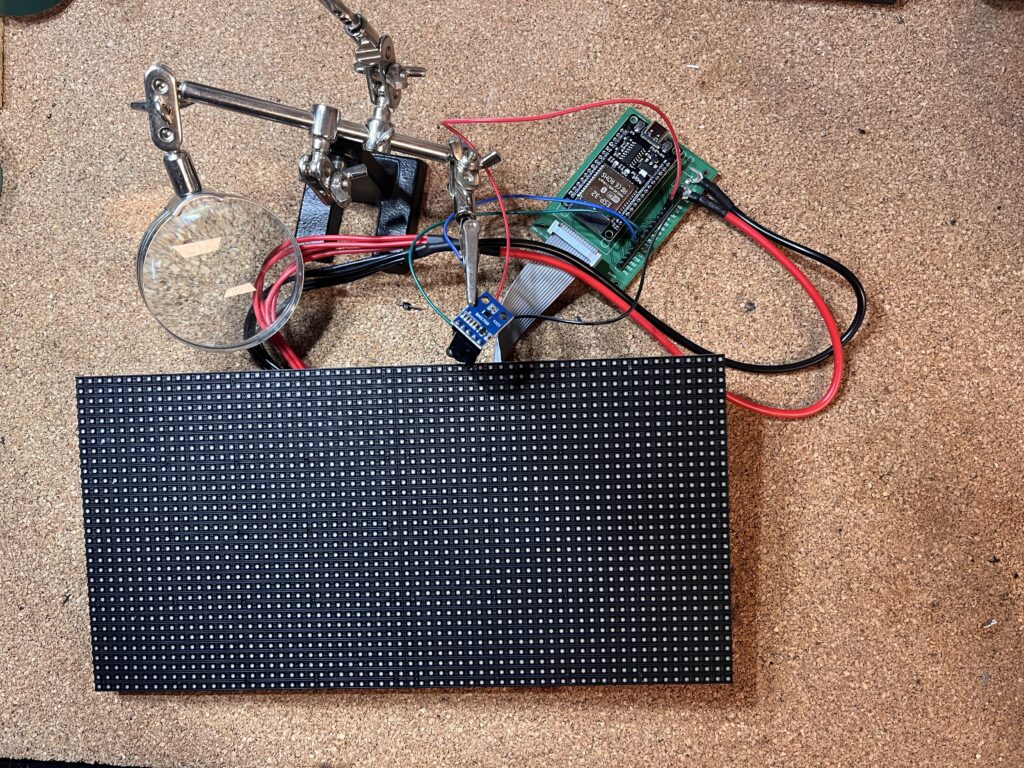
PCB-based prototype.
10. Enclosure and Final Assembly
After the electronics were working, I built an enclosure for the clock. The enclosure protects the electronics and gives the project a cleaner look.
For one version, I used a simple prototype case. For another version, I created a laser-cut enclosure. Both approaches work, and the best option depends on the tools available.
When designing the enclosure, it is important to leave enough space for:
- The LED matrix display
- The ESP32 and PCB
- The power connector
- The light sensor
- Cable routing
- Ventilation, if required
11. Final Result
The final Elektroclock is a compact smart clock based on an ESP32 and a P4 LED matrix display. It shows the current time and weather information, updates the weather automatically, and adjusts its brightness depending on the room lighting.
This project is a good example of how a complex electronics project can be developed step by step. First, the display is tested on its own. Then Wi-Fi, time synchronization, weather data, and brightness control are added. Finally, the prototype is turned into a cleaner PCB-based version with an enclosure.
The full code, schematic, parts list, and additional project files are available on the Elektroclock project page.
Feel free to recreate this project and modify it for your own setup. You can change the display layout, add more weather information, use a different enclosure, or expand the PCB with additional features.